Unveiling the Power of Data Visualization in BIM Projects: Processes, Advantages, Disadvantages, and Essential Tools
Tweet
In the dynamic landscape of the construction industry, Building Information Modeling (BIM) has emerged as a game-changer, transforming the way projects are planned, designed, and executed. Amidst this digital revolution, the integration of data visualization in BIM projects stands out as a powerful tool that enhances decision-making, fosters collaboration, and provides stakeholders with a clear understanding of complex project information.
The Process of Data Visualization in BIM Projects
1. Data Collection and Integration:
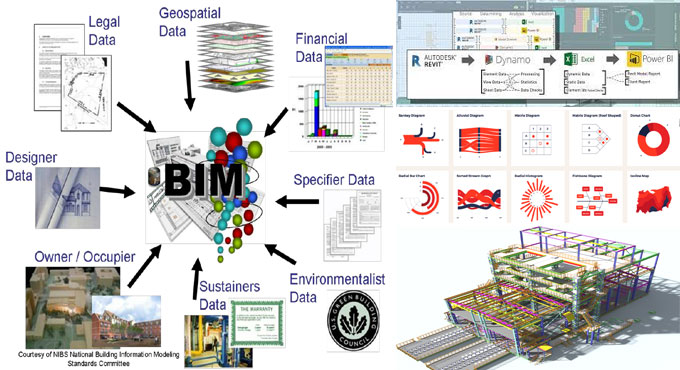
The data visualization process in BIM projects begins with the collection and integration of diverse datasets. These datasets may include architectural, structural, and MEP (Mechanical, Electrical, Plumbing) information. The integration process involves bringing together data from various sources into a centralized BIM model, creating a comprehensive and interconnected representation of the entire project.
2. Data Structuring and Standardization:
Once the data is integrated, the next step involves structuring and standardizing it to ensure consistency and compatibility. This process involves defining data hierarchies, classifications, and standards, allowing stakeholders to access and interpret information uniformly. Standardization is crucial for creating a cohesive and reliable foundation for the visualization phase.
3. Visualization Techniques:
There are various visualization techniques employed in BIM projects to represent data in a meaningful and easily digestible manner. These techniques include:
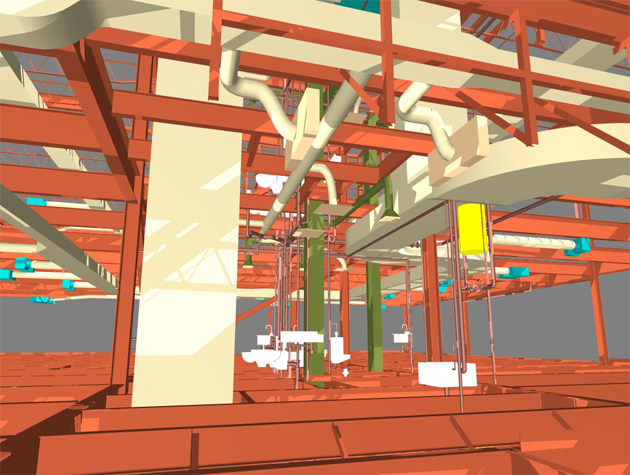
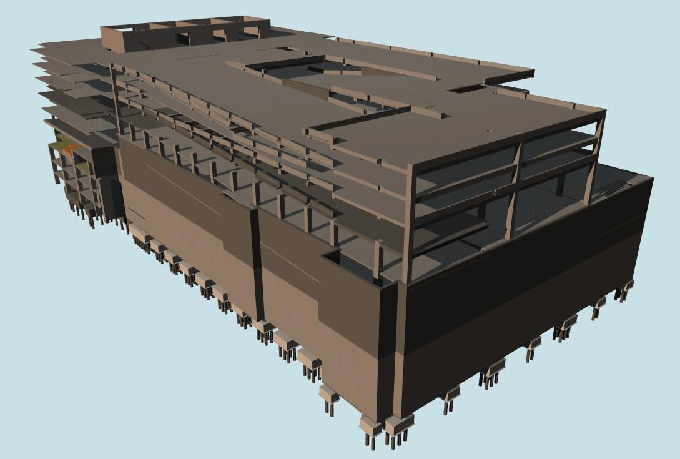
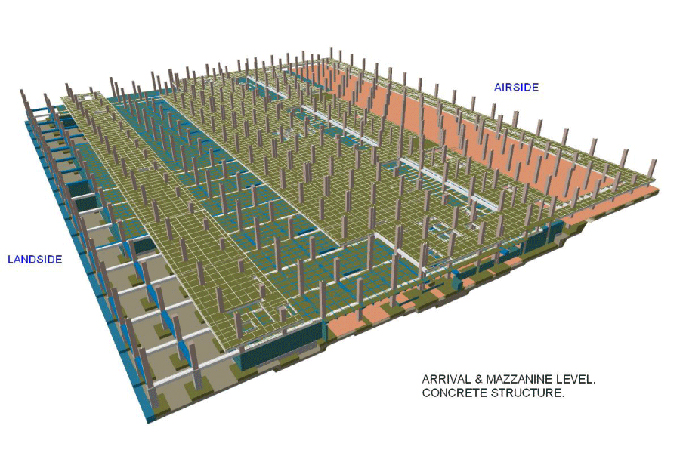
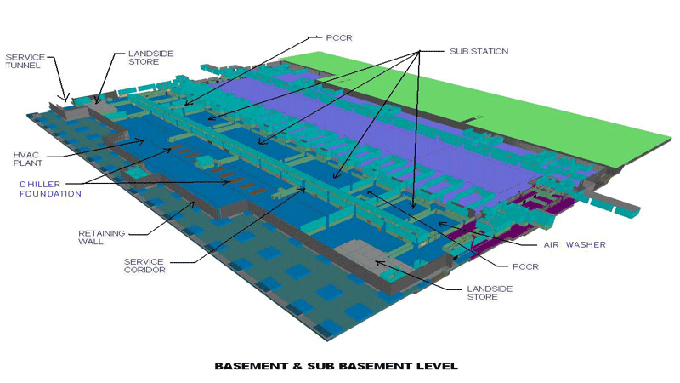
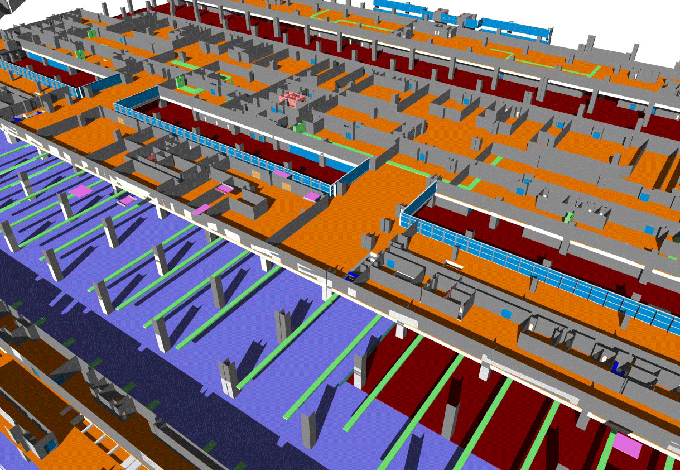
a. 3D Modeling: Creating three-dimensional models enables stakeholders to visualize the entire project in a spatial context, aiding in better understanding and decision-making.
b. Charts and Graphs: Utilizing charts and graphs to represent project data, such as cost breakdowns, timelines, and resource allocation, provides stakeholders with clear insights at a glance.
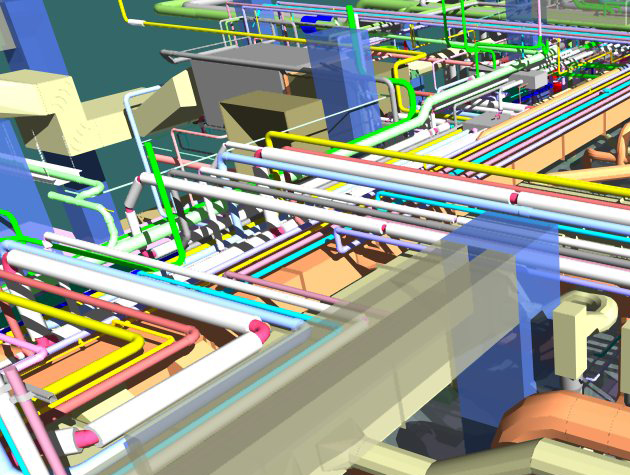
c. Color Coding: Implementing color-coded elements in the BIM model helps highlight specific information, such as materials, project phases, or system types, making it easier for stakeholders to identify and interpret data.
d. Animated Visualizations: Incorporating animations into the BIM model allows stakeholders to visualize the project's evolution over time, showcasing construction sequences, phasing, and dynamic changes.
4. Interactive Dashboards:
Developing interactive dashboards is a key aspect of the data visualization process. These dashboards provide stakeholders with a user-friendly interface to explore and interact with the BIM model. Users can filter, drill down, and manipulate data parameters in real-time, enhancing their ability to extract meaningful insights from the project information.
5. Data Analysis and Interpretation:
Data analysis is at the core of the data visualization process. Stakeholders use the visualized data to analyze project performance, identify trends, assess risks, and make informed decisions. The ability to interpret complex data sets quickly and accurately is a significant advantage of data visualization in BIM projects.
II. Advantages of Data Visualization in BIM Projects
1. Improved Decision-Making:
One of the primary advantages of data visualization in BIM projects is its ability to facilitate informed decision-making. Stakeholders can quickly grasp complex information, identify patterns, and make decisions based on a visual representation of the project's data. This leads to more efficient and effective project management.
2. Enhanced Collaboration:
Data visualization fosters collaboration among project stakeholders by providing a shared understanding of the project's status and requirements. Through visual representations, architects, engineers, contractors, and clients can communicate more effectively, reducing misunderstandings and streamlining collaboration.
3. Early Issue Identification:
Visualizing data in a BIM model allows for early identification of potential issues or clashes. By using 3D modeling and clash detection, stakeholders can address problems in the design phase, minimizing the need for costly changes during construction.
4. Stakeholder Engagement:
Engaging stakeholders in the project becomes more accessible with data visualization. Non-technical stakeholders, such as clients and investors, can easily comprehend project details, making it easier to gain support and approvals. This transparency enhances trust and client satisfaction.
5. Efficient Resource Management:
Visualization tools enable efficient resource management by providing a clear overview of resource allocation, schedules, and project timelines. Project managers can optimize resource usage, identify bottlenecks, and make adjustments to enhance overall project efficiency.
6. Risk Mitigation:
Data visualization aids in risk management by highlighting potential risks and uncertainties. Visualization techniques such as color coding can draw attention to critical areas, allowing stakeholders to proactively address challenges before they escalate.
Disadvantages and Challenges of Data Visualization in BIM Projects
1. Learning Curve:
Implementing data visualization tools in BIM projects may require training for stakeholders unfamiliar with these technologies. Overcoming the learning curve associated with new visualization tools can pose a temporary challenge for teams transitioning to a more visual project management approach.
2. Integration Complexity:
Integrating diverse datasets from various sources can be complex. Ensuring seamless integration and data standardization may require additional effort and technical expertise, especially in projects involving multiple disciplines.
3. Technology Dependence:
Relying heavily on data visualization tools makes projects susceptible to technological dependencies. Technical glitches, software updates, or changes in tool compatibility can disrupt the visualization process if not managed proactively.
4. Data Security Concerns:
The integration and visualization of project data may raise concerns regarding data security. Safeguarding sensitive project information and ensuring compliance with data protection regulations is paramount to mitigate potential risks.
5. Overemphasis on Aesthetics:
While aesthetics are essential for effective data visualization, an overemphasis on visual appeal may lead to misinterpretation. Stakeholders should prioritize clarity and accuracy to ensure that the visualized data effectively communicates the intended information.
Essential Tools for Data Visualization in BIM Projects
1. Autodesk BIM 360:
Autodesk BIM 360 is a cloud-based platform that provides collaboration and data management tools for BIM projects. It offers features like 3D model viewing, issue tracking, and real-time collaboration, enhancing data visualization capabilities throughout the project lifecycle.
2. Navisworks:
Autodesk Navisworks is a comprehensive project review software that facilitates model coordination, clash detection, and 5D analysis. It enables stakeholders to visualize project data in a coordinated 3D model, aiding in clash resolution and construction sequencing.
3. Revit:
Autodesk Revit is widely used for BIM modeling and provides robust visualization capabilities. With features like 3D views, schedules, and interactive walkthroughs, Revit allows users to create visually rich and detailed representations of the project.
4. Solibri:
Solibri Model Checker is a BIM quality assurance software that includes advanced model checking and validation capabilities. It helps in visualizing and analyzing models for compliance, coordination, and quality, ensuring a high level of accuracy.
5. Tableau:
Tableau is a powerful data visualization tool that can be integrated with BIM data for creating interactive dashboards. It allows users to connect to various data sources, visualize trends, and share insights across project teams.
6. Power BI:
Microsoft Power BI is another robust data visualization tool that enables users to create interactive reports and dashboards. It can be integrated with BIM data to provide stakeholders with real-time insights into project performance.
To get online demonstration, watch the following video tutorial.
Video Source: Symetri UK
Future Trends in Data Visualization for BIM Projects
As technology continues to evolve, several trends are shaping the future of data visualization in BIM projects:
1. Augmented Reality (AR) and Virtual Reality (VR):
The integration of AR and VR technologies is expected to enhance data visualization in BIM projects. Stakeholders will have immersive experiences, allowing them to interact with and explore BIM models in a virtual environment.
2. Artificial Intelligence (AI):
AI algorithms are anticipated to play a significant role in data analysis and interpretation. AI-driven tools may provide automated insights, predictive analytics, and advanced visualization techniques, further improving decision-making processes.
3. Cloud-Based Collaboration:
The use of cloud-based platforms for data storage and collaboration is likely to become more prevalent. This trend enables real-time collaboration and access to project data from anywhere, fostering a more flexible and collaborative project environment.
4. Advanced 4D and 5D Visualization:
The integration of time (4D) and cost (5D) dimensions into BIM visualization will become more sophisticated. This evolution allows stakeholders to visualize project progress over time and understand the financial implications of decisions.
Gallery
Feel free to contact us for BIM requirements. One of our representative will respond you within 24 Hours. Send us your projects requirement today and grow your project.
Explore More !